Wyckoff analysis (WA) aims to understand why the prices of stocks and other market goods change based on supply and demand dynamics. Typically it is applied to any freely traded market where major or institutional traders operate (commodities, bonds, currencies, etc.). In this article, we apply WA to the cryptocurrency Storj ($STORJ) to create a forecast for approximate future events.
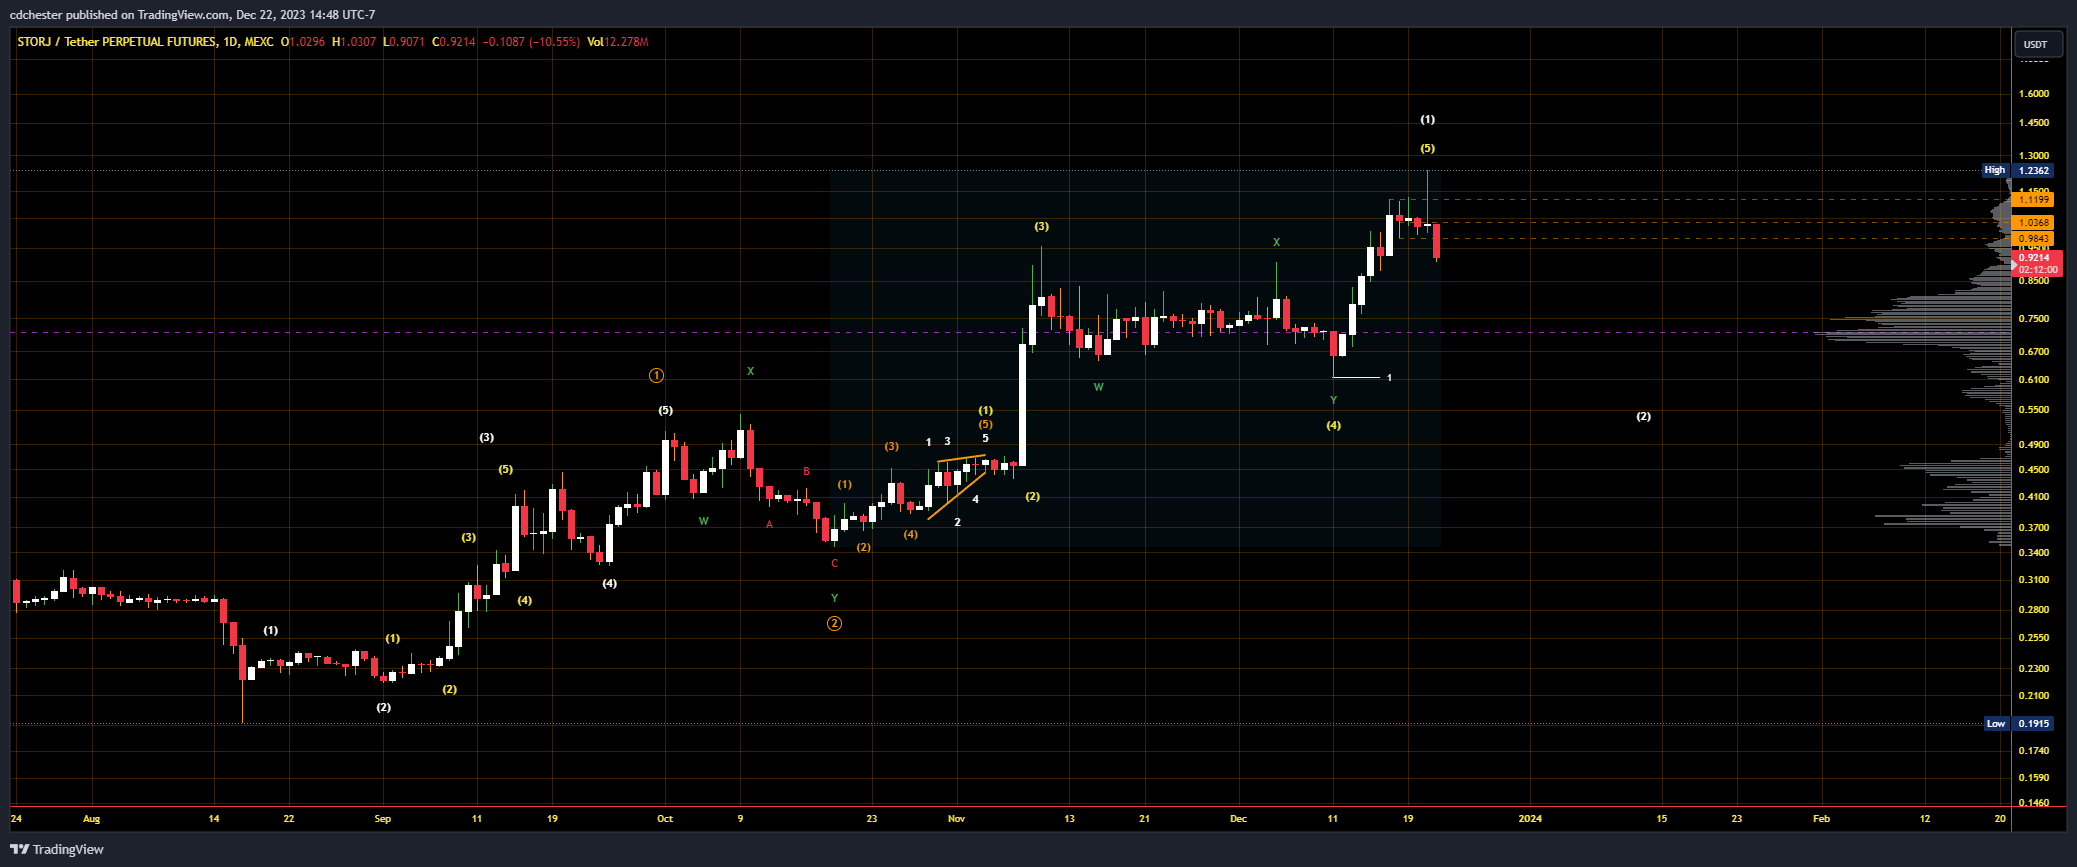
Storj price data from MEXC Futures | Source: STORJUSDT.P on Tradingview.com.
Link to raw image: https://www.tradingview.com/x/BGsOkzGM
Storj is currently in Phase E of a Wyckoff Distribution Scheme #1. StockCharts says this about Phase E in their Wyckoff Method article:
Phase E shows the development of the downward trend; The inventory leaves the TR and the supply is under control. Once TR support is broken at a key SOW, this breakdown is often tested with a rally that fails at or near the support. This also presents a high probability short selling opportunity. Subsequent rallies during the discount are usually weak. Traders who have taken short positions can tighten their stops if prices fall. After a significant downward move, a peak can signal the beginning of a redistribution TR or accumulation.
The trading range for Storj was between $1 and $1.12 and specifically fell below that. In the image below, a large SOW has occurred, which rather suggests that a distribution has occurred. This also lines up with our analyst's Elliott Wave (EWT) view on Storj. They are predicting a small rally as Storj continues to fall in its wave 2. The bulk of the liquidity (according to the relevant volume profile) is between 38.2% and 61.8% LFR at $0.56 and $0.76 respectively. Typically, a liquidity cluster is expected between these LFRs in EWT, leading us to believe that a Wave 2 correction is occurring. Furthermore, the cluster lies in the price range of Subwave 4, an EWT policy.
Storj price data from MEXC Futures | Source: STORJUSDT.P on Tradingview.com.
Link to raw image: https://www.tradingview.com/x/dD8hv9Aj
Below is the typical scheme for a Wyckoff distribution scheme #1.
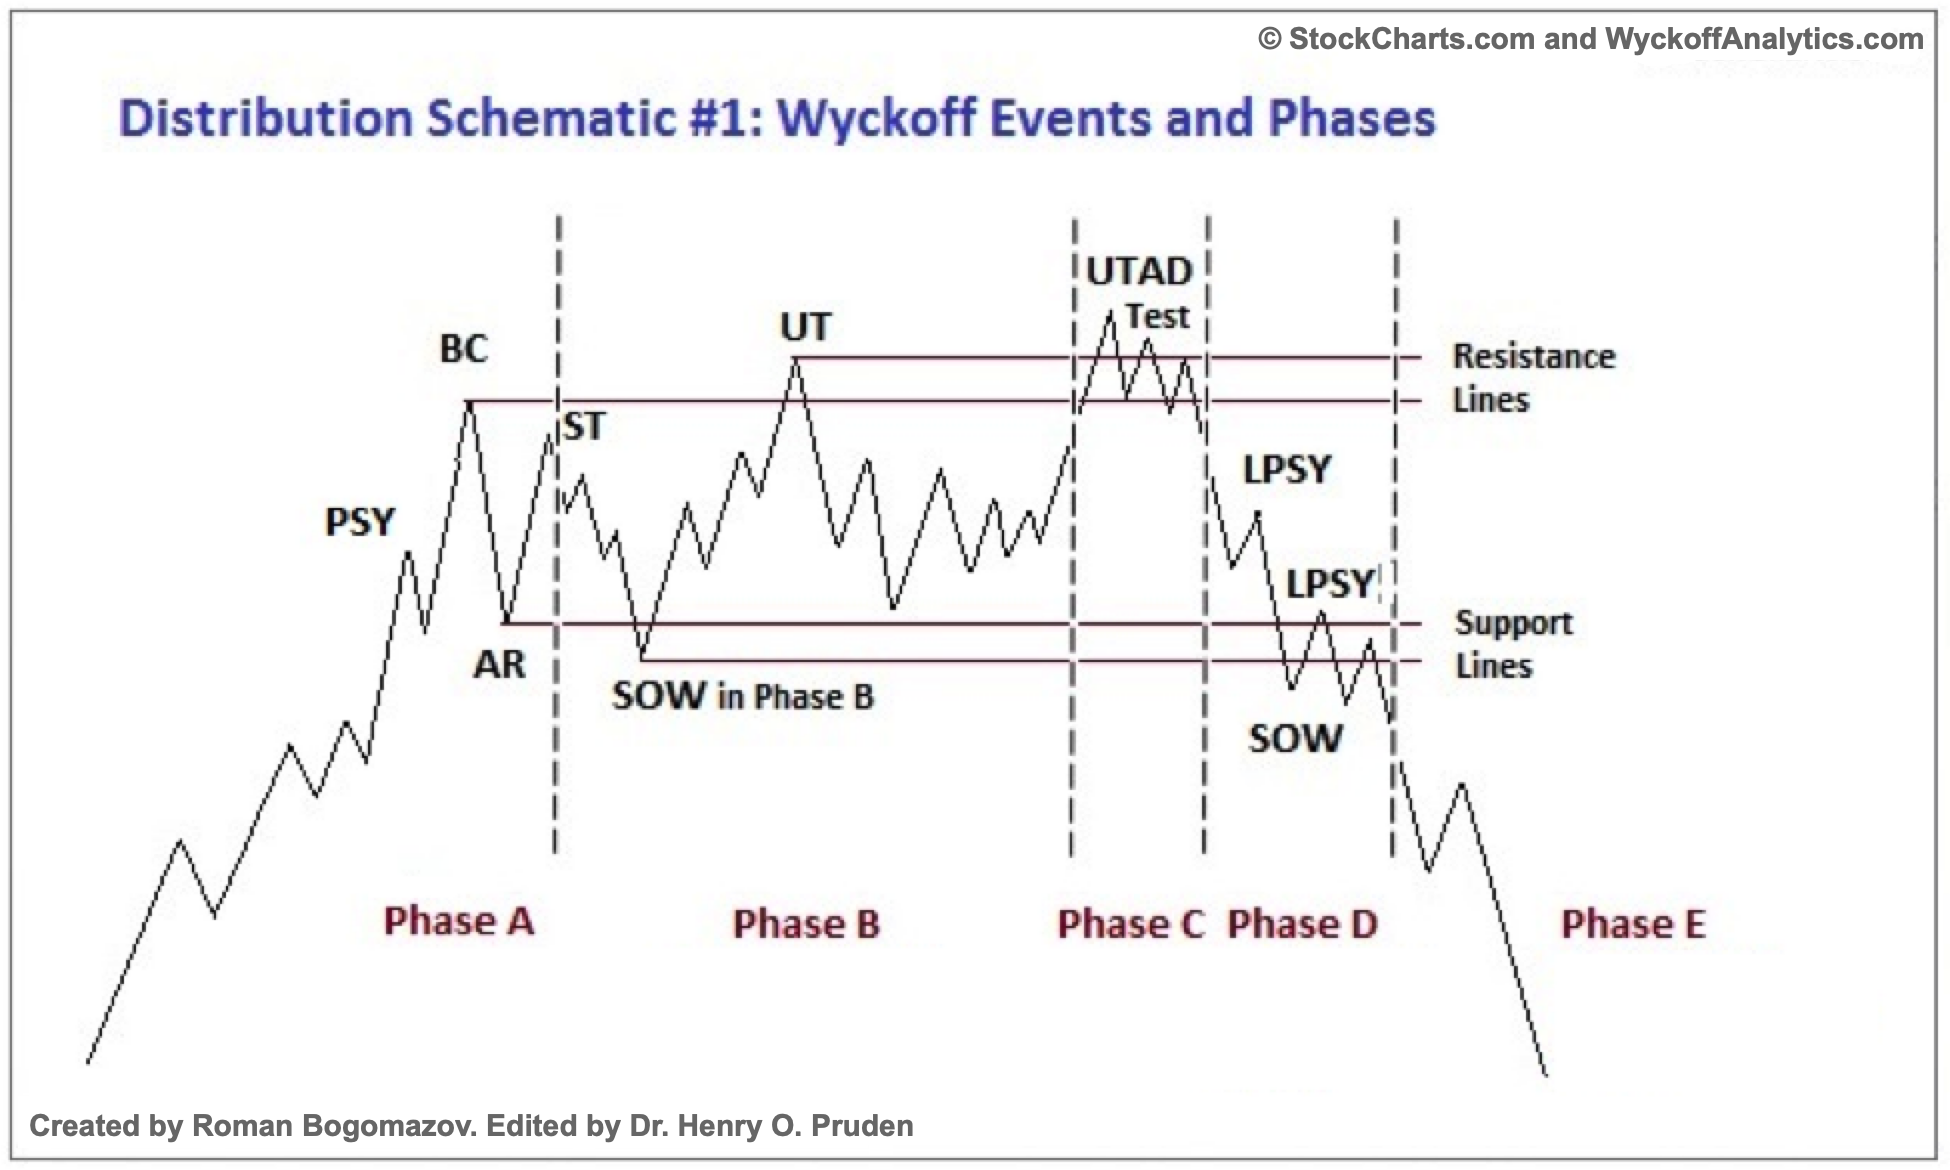
Wyckoff distribution scheme #1 | Source: StockCharts.com
glossary
All quotes are from the first link in Supplemental Reading.
Preliminary delivery (PSY) – “where big interests start dumping shares in large quantities after a significant uptrend”
Buy climax (BC) – Large operators sell their shares while the public buys them at a premium during times of high demand
Automatic response (AR) – “As intensive buying has significantly decreased after the BC and strong supply continues, an AR is occurring”
Secondary test (ST) – when “price revisits the SC area to test the balance between supply and demand at these levels”
Buoyancy after distribution (OUTSIDE) – “a definitive test of new demand for a breakout above TR resistance”
Check – where larger traders “test the market for supply during a TR”
sign of weakness (sow) – “a downward movement toward (or slightly beyond) the lower limit of the TR, which typically occurs with increased spread and volume.”
Last supply point (LPSY) – “Depletion of demand and the last waves of distribution by large operators before the discount actually begins”
Elliott wave theory (EWT)
“A theory of technical analysis that attributes wave-like price patterns identified at various scales to the psychology of traders and investor sentiment.”
Source: “Elliott Wave Theory: What It Is and How to Use It” by James Chen (2023)
Logarithmic Fibonacci retracement (LFR) – A measured correction at specific Fibonacci ratios on a semi-logarithmic scale.
Logarithmic Fibonacci expansions (LFE) – A measured rally at specific Fibonacci ratios on a semi-logarithmic scale.
Supplementary reading
“The Wyckoff Method: A Tutorial” by Bogomazov & Lipsett
“Reaccumulation Review” by Bruce Fraser (2018)
Jumping the Creek: A Review by Bruce Fraser (2018)
“Distribution Review” by Bruce Fraser (2018)
“Introduction to Point & Figure Charts” from StockCharts
“P&F Price Targets: Horizontal Counts” by StockCharts
“The Wyckoff methodology in detail” by Rubén Villahermosa (2019)
“Wyckoff 2.0: Structures, Volume Profile and Order Flow” by Rubén Villahermosa (2021)
“Elliott Wave Principle – Key to Market Behavior” by Frost & Prechter (2022)
Disclaimer: The article is for educational purposes only. It does not represent NewsBTC's opinion on whether investments should be bought, sold or held, and investments obviously involve risks. We recommend that you do your own research before making any investment decisions. Use of the information provided on this website is entirely at your own risk.